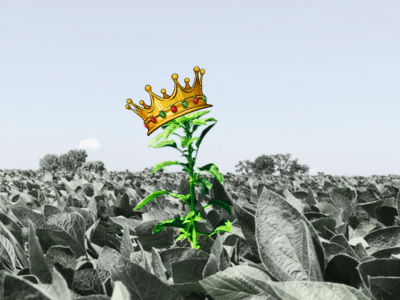
For three days, a trio of weeds fought fiercely for the title of тАЬWorst WeedтАЩ at the 2026 Commodity Classic in San Antonio, Texas, but only one took home the title тАУ waterhemp.
In truth, the outcome was clear from day one. ThatтАЩs when the first stream of farmers from the Midwest visited GROW and Take ActionтАЩs tradeshow booth, and started staking out the battlefield (a foamboard map titled тАЬWhatтАЩs Your Worst Weed?тАЭ) with tiny orange pins representing waterhemp.┬а
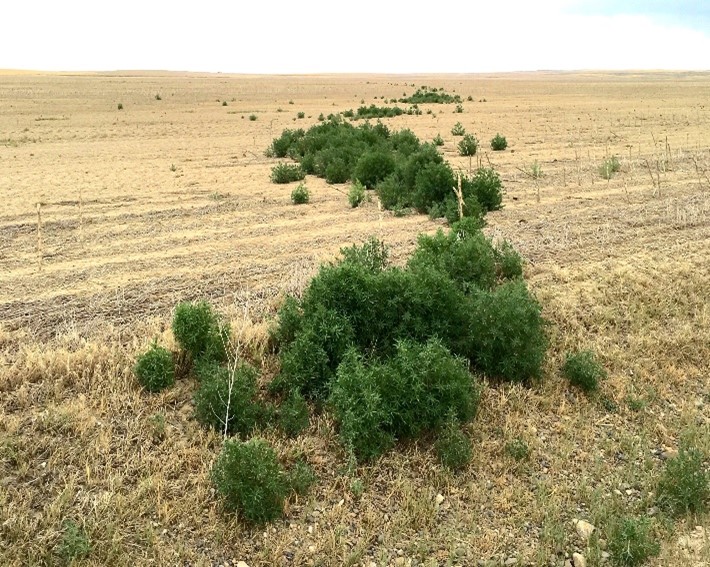
For the next two days, farmers from the mid-South, Southeast and mid-Atlantic added dozens of yellow pins to the board, for Palmer amaranth. Western and Great Plains farmers filled their states with green pins, for kochia.
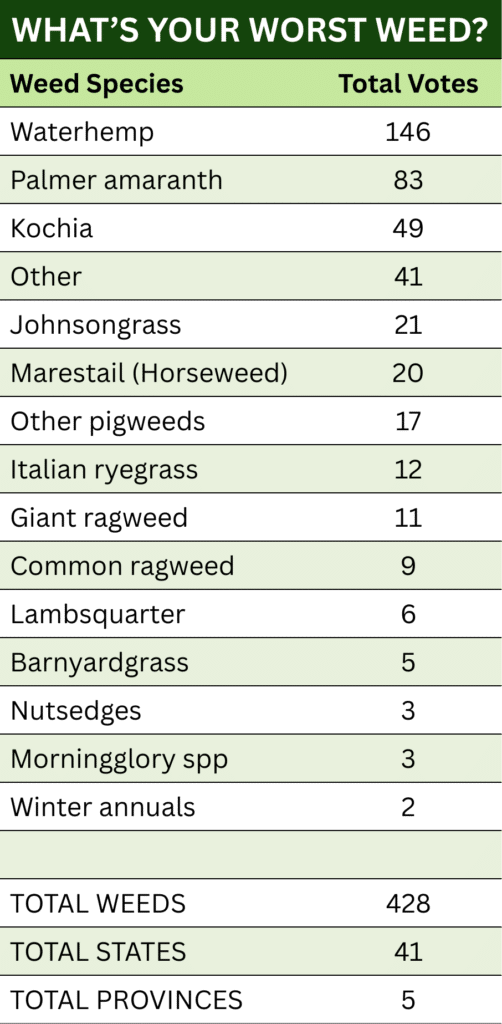
But they couldnтАЩt outnumber waterhemp, which was ultimately selected by 146 farmers, landing as the top weed chosen for Indiana, Illinois, Iowa, Michigan, Minnesota, Missouri, Ohio, South Dakota and Wisconsin.
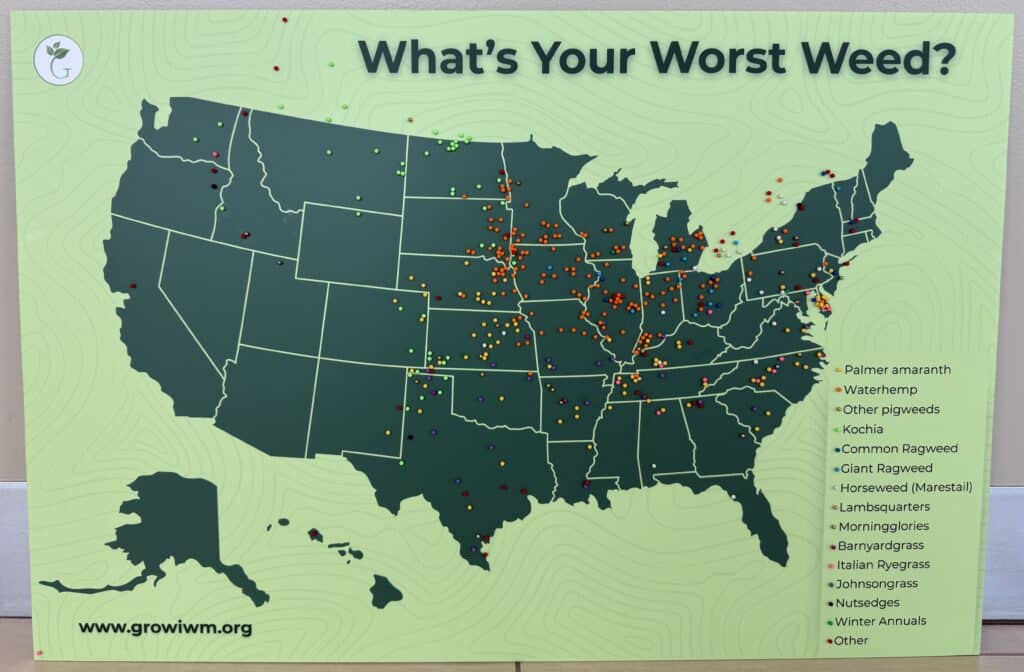
Palmer amaranth came in a distant second place with 83 votes, but earned an Honorable Mention for greatest geographic range, cropping up in the most states. This aggressive herbicide-resistant pigweed was voted the top weed for Alabama, Arkansas, the Carolinas, Colorado, Delaware, Kansas, Kentucky, Louisiana, Maryland, Mississippi, Nebraska, New Mexico, Tennessee and Virginia.
Kochia tumbled into third place with 49 votes, mostly from farmers in Montana, North Dakota, Texas, Washington, Wyoming and the Canadian provinces of Manitoba, Saskatchewan and Alberta.
Ultimately nearly 430 farmers from the U.S. and Canada took a stab at the Worst Weed Map over the course of the trade show. Their votes closely matched the 2025 Common and Troublesome Weed Survey from the Weed Science Society of America, where Palmer amaranth, kochia and waterhemp ranked 2nd, 3rd, and 4th, respectively.┬а
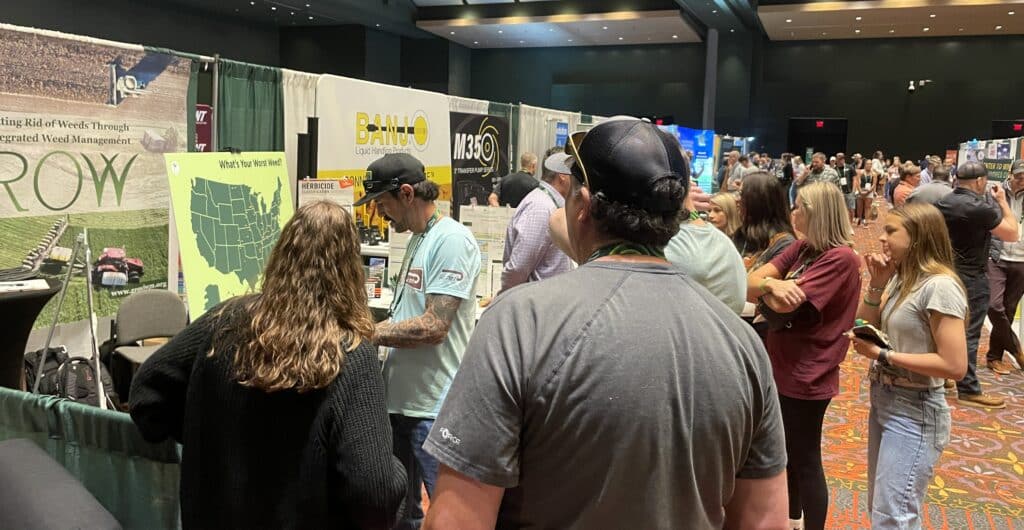
Yet while the winners were clear and unsurprising, the diversity of troublesome weeds on the map was striking, says Dr. Mark VanGessel, University of Delaware weed specialist, who helped farmers navigate the Worst Weed Map in San Antonio.
тАЬAt least eighteen different species were considered the worst by those visiting the booth,тАЭ VanGessel points out. тАЬFor example, Illinois had the most pins for waterhemp, but it was only one of seven species listed as the worst for that state. So as weed scientists we cannot get tunnel vision and only focus on one or two speciesтАЭ.
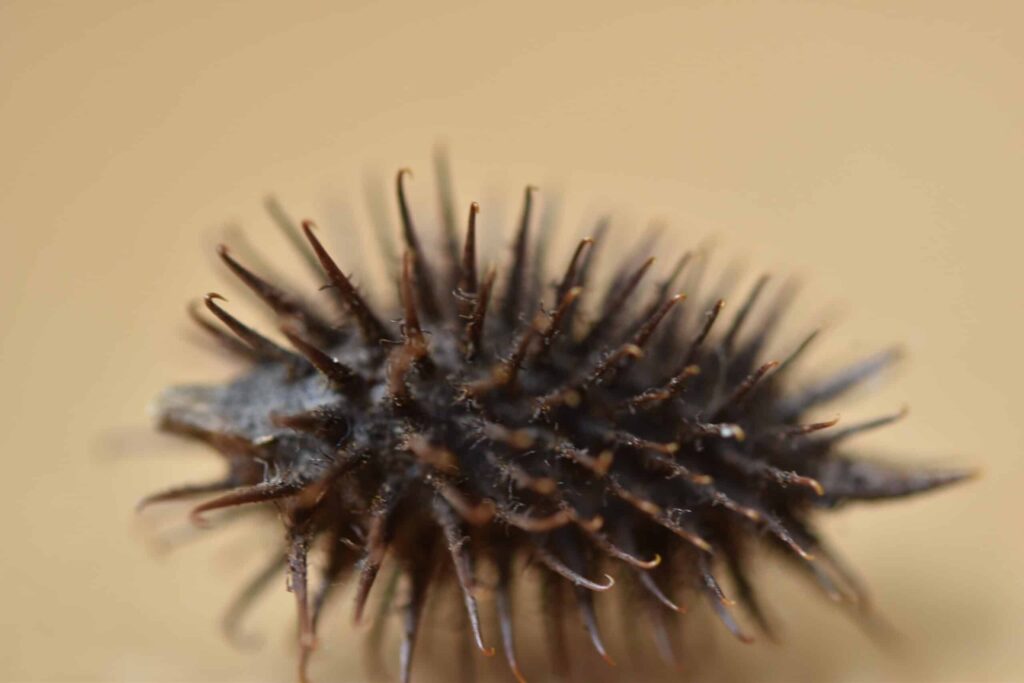
The fourth place winner was actually the тАЬotherтАЭ category, which included a broad range of weeds beyond the 14 colored pins the GROW/Take Action booth provided. Burcucumber, sicklepod, velvetleaf and Canada thistle were popular тАЬotherтАЭ choices.
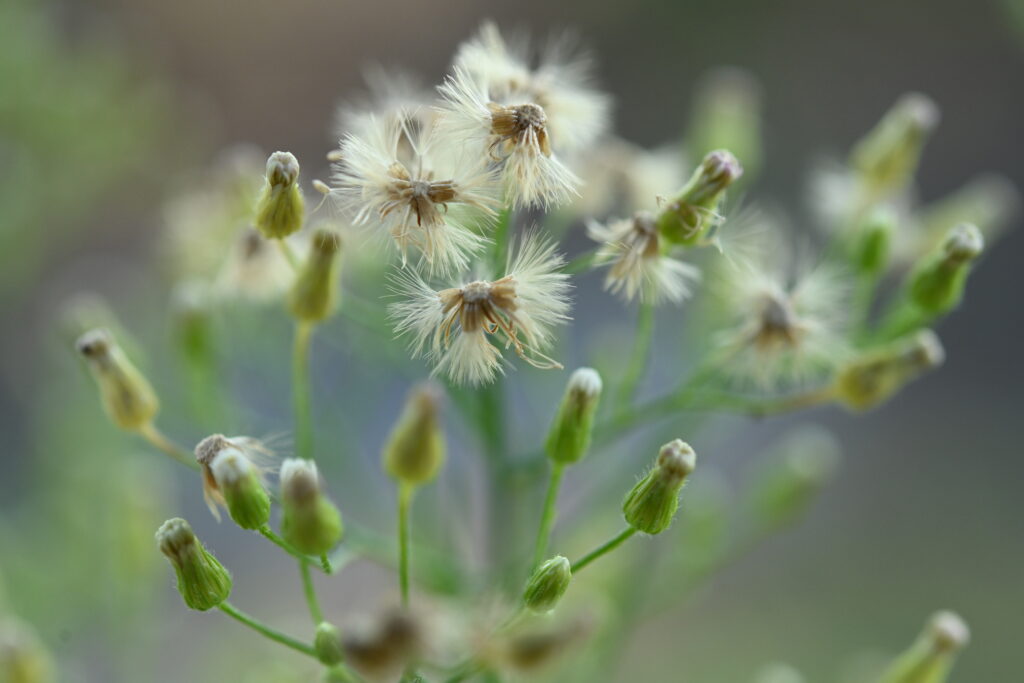
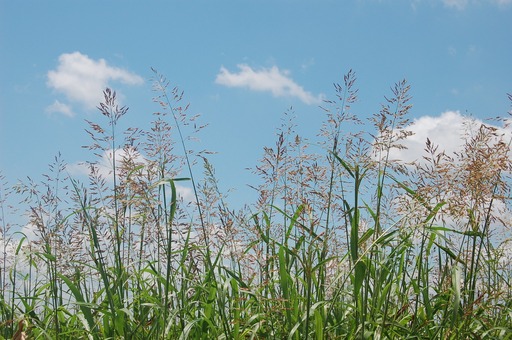
Johnsongrass edged out marestail for fifth place, with a belt of the grass weedтАЩs purple pins emerging from Texas through Arkansas, southern Missouri and Tennessee, to the shores of the Atlantic in South Carolina.
Marestail was almost as common but more geographically spotty, surfacing most often in the Northeast (including Ontario) but also cropping up in Midwestern states like Michigan and Indiana and as far west as Kansas.
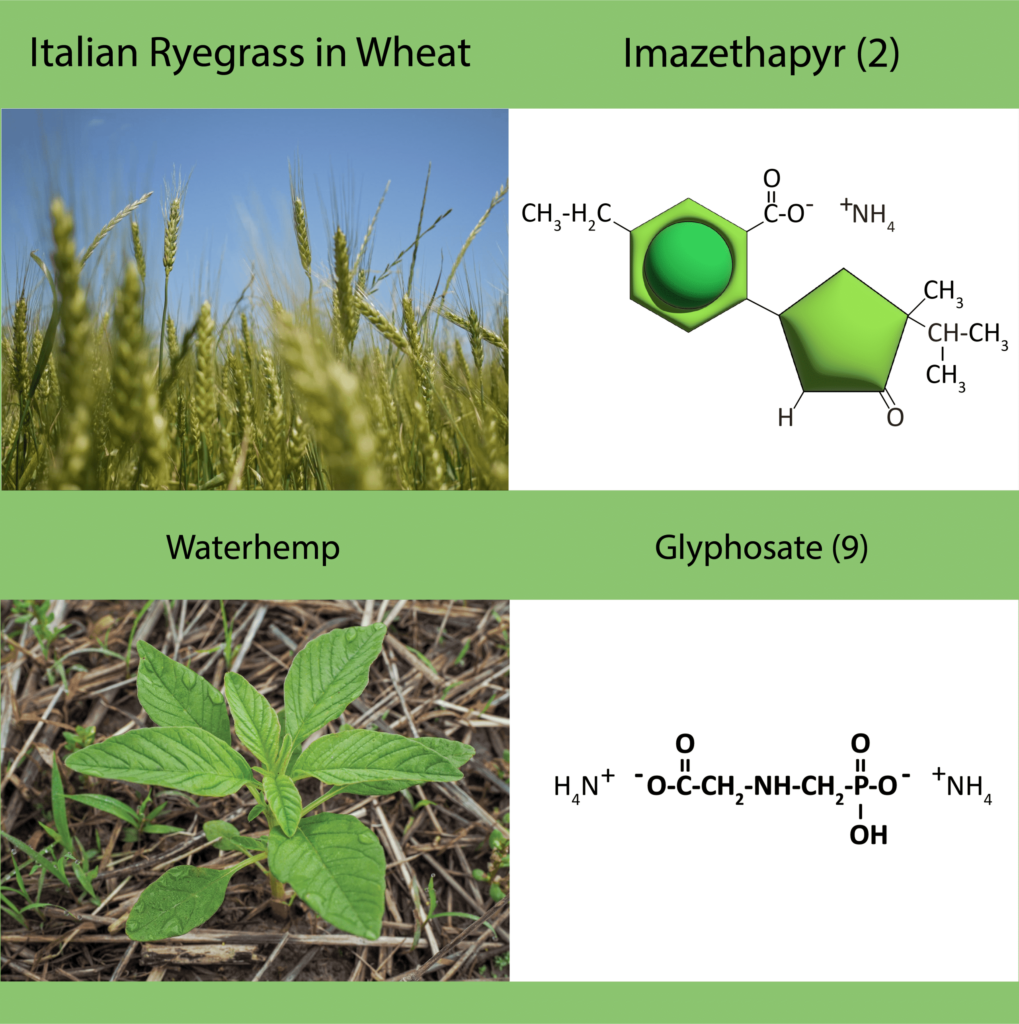
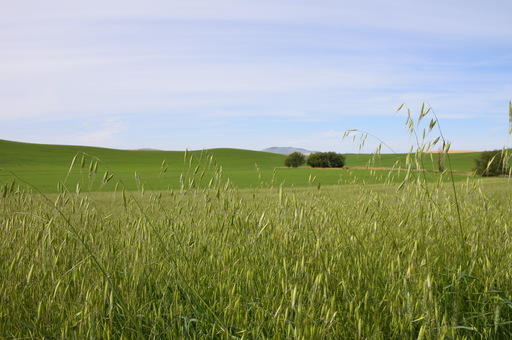
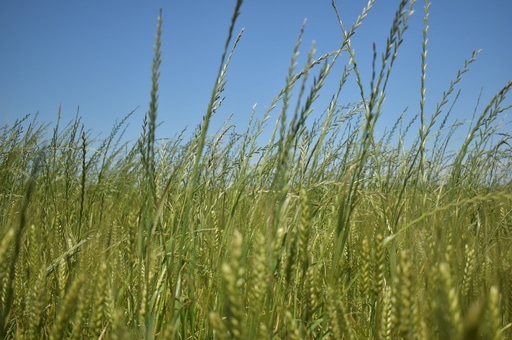
From there, the trends scattered тАУ Italian ryegrass pestered farmers in the mid-Atlantic and Southeast, while giant and common ragweed mostly troubled Midwestern farmers, particularly in the Great Lakes region.
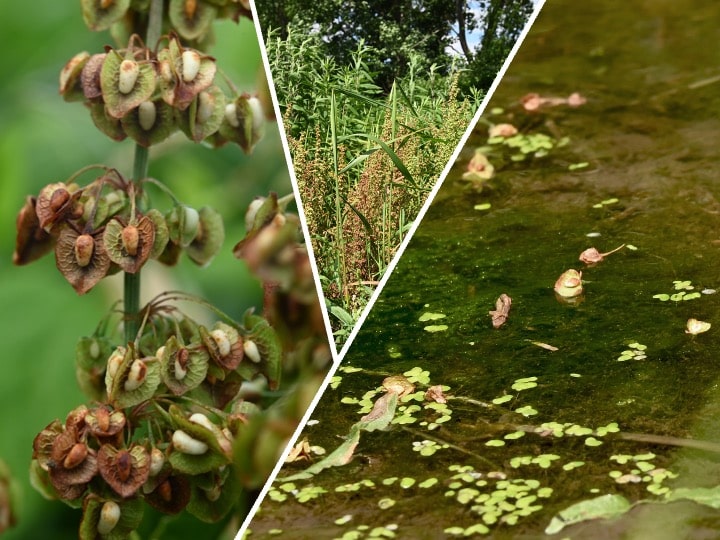
And here is where the Worst Weed Map departs sharply from WSSAтАЩs 2025 Common and Troublesome weed survey тАУ with lambsquarter. This was the number one weed selected in the WSSA survey, but it proved a mere blip in San Antonio, coming in 11th place with a measly six votes, mostly in the Northeast.
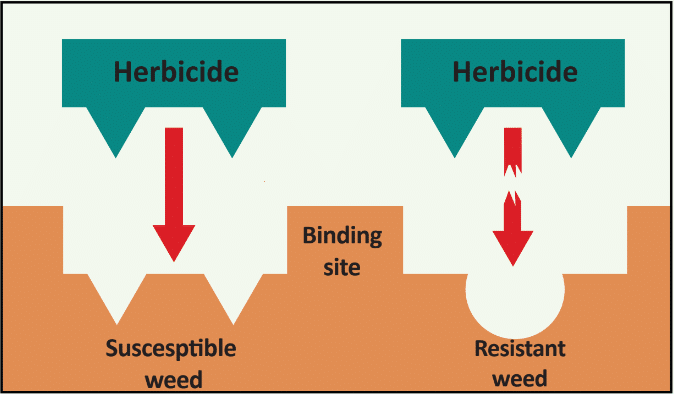
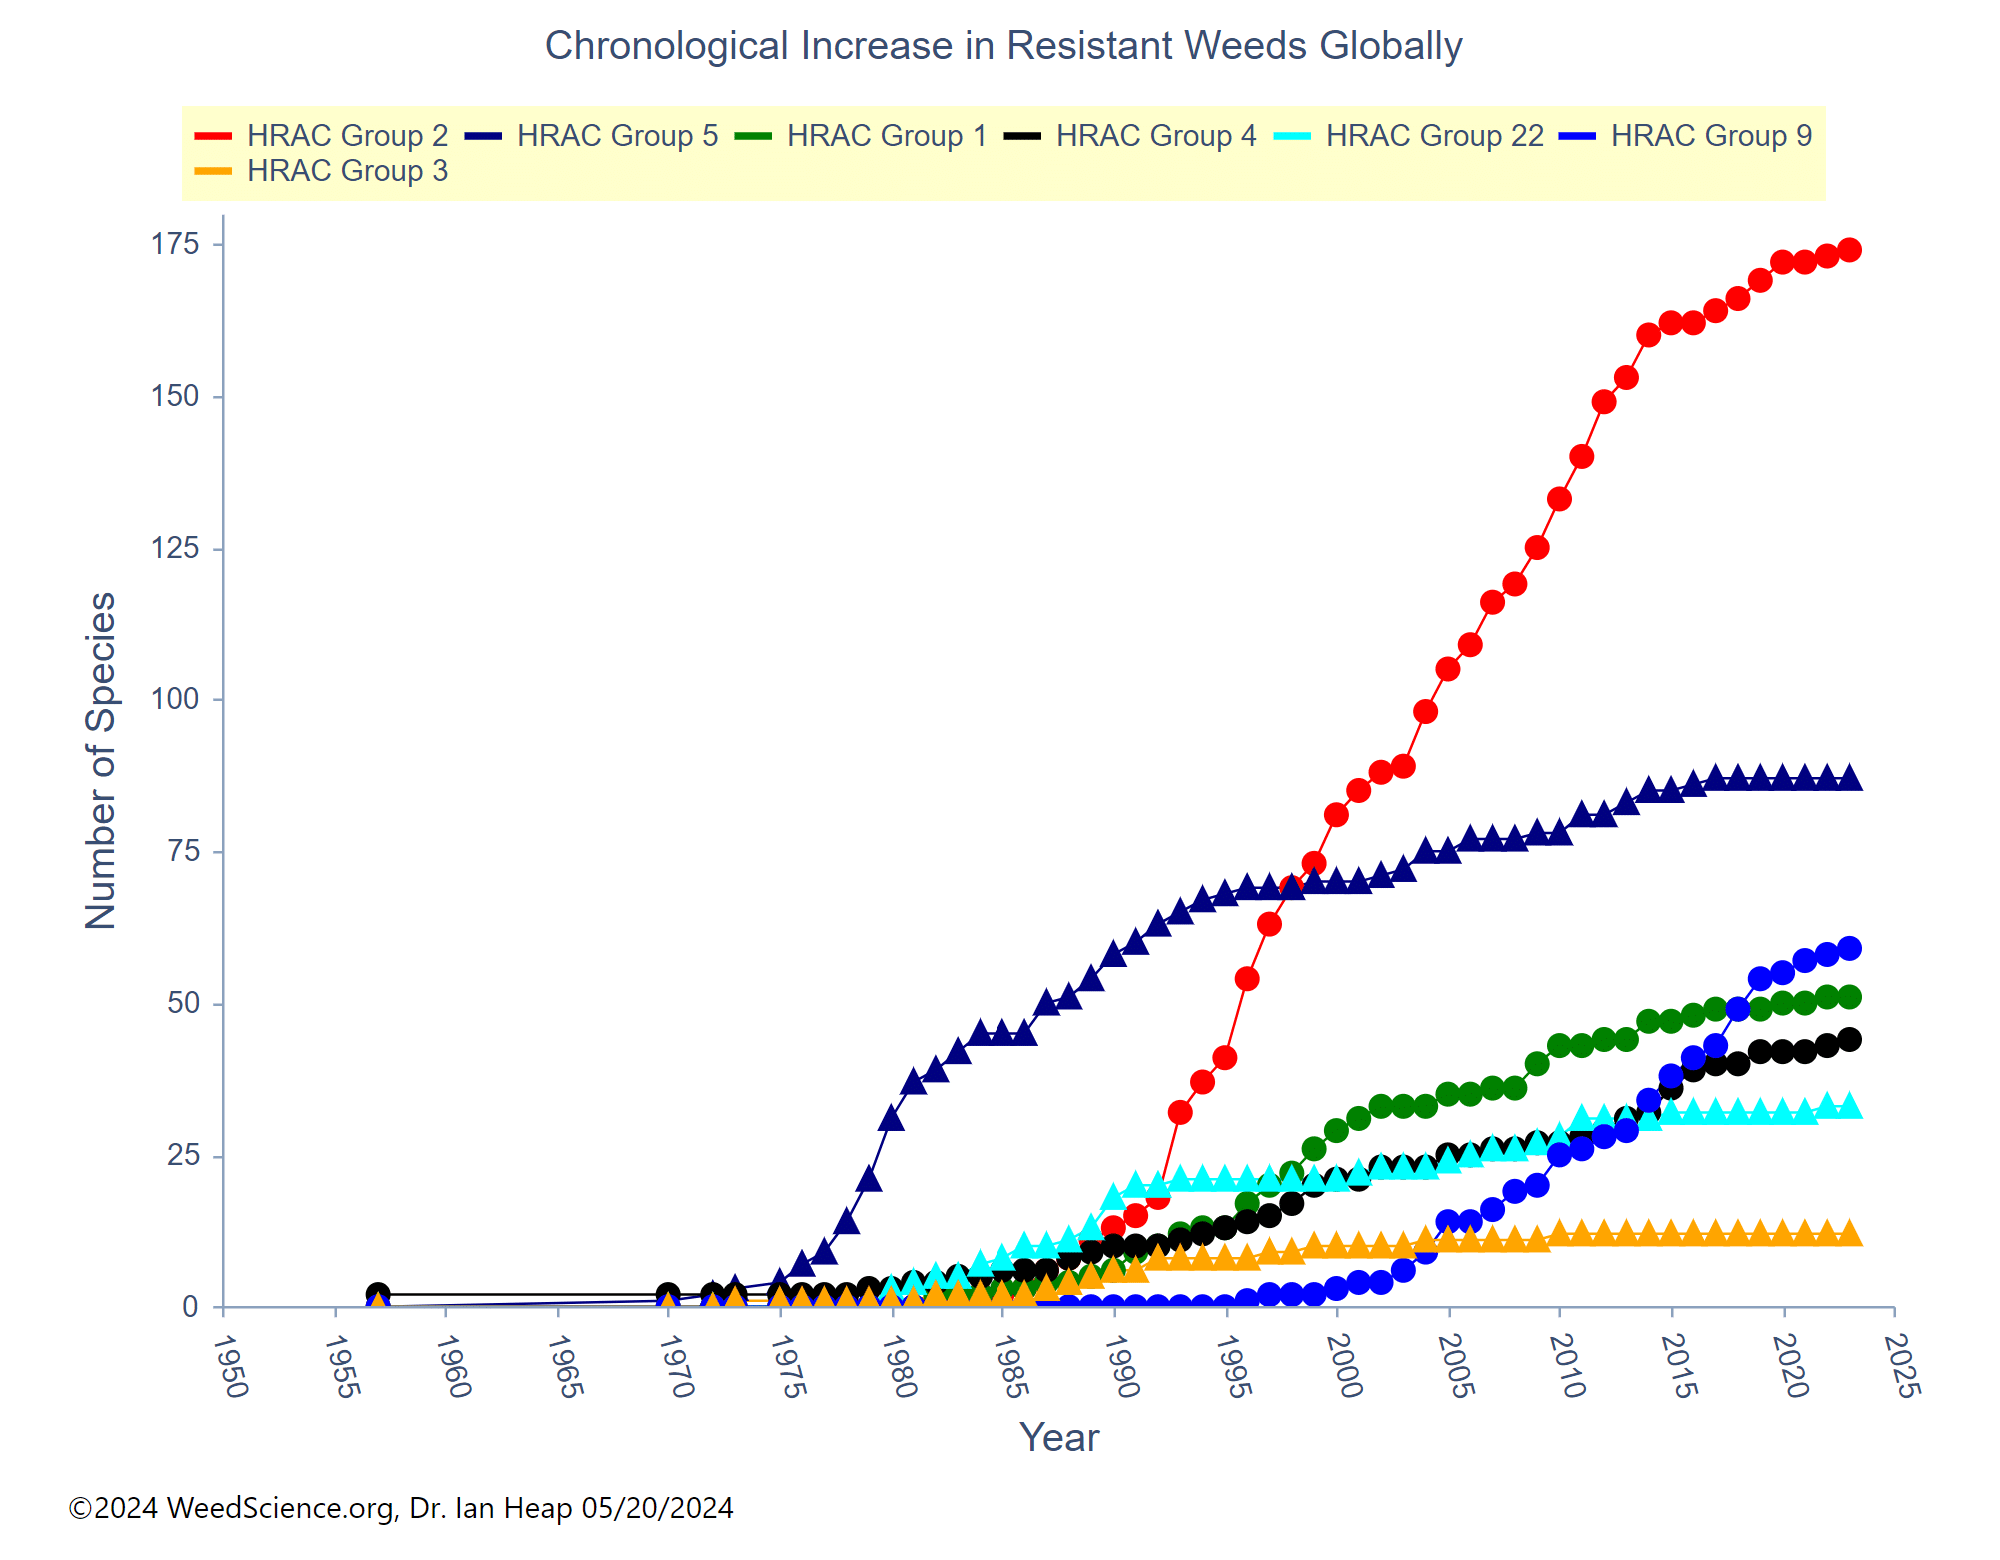
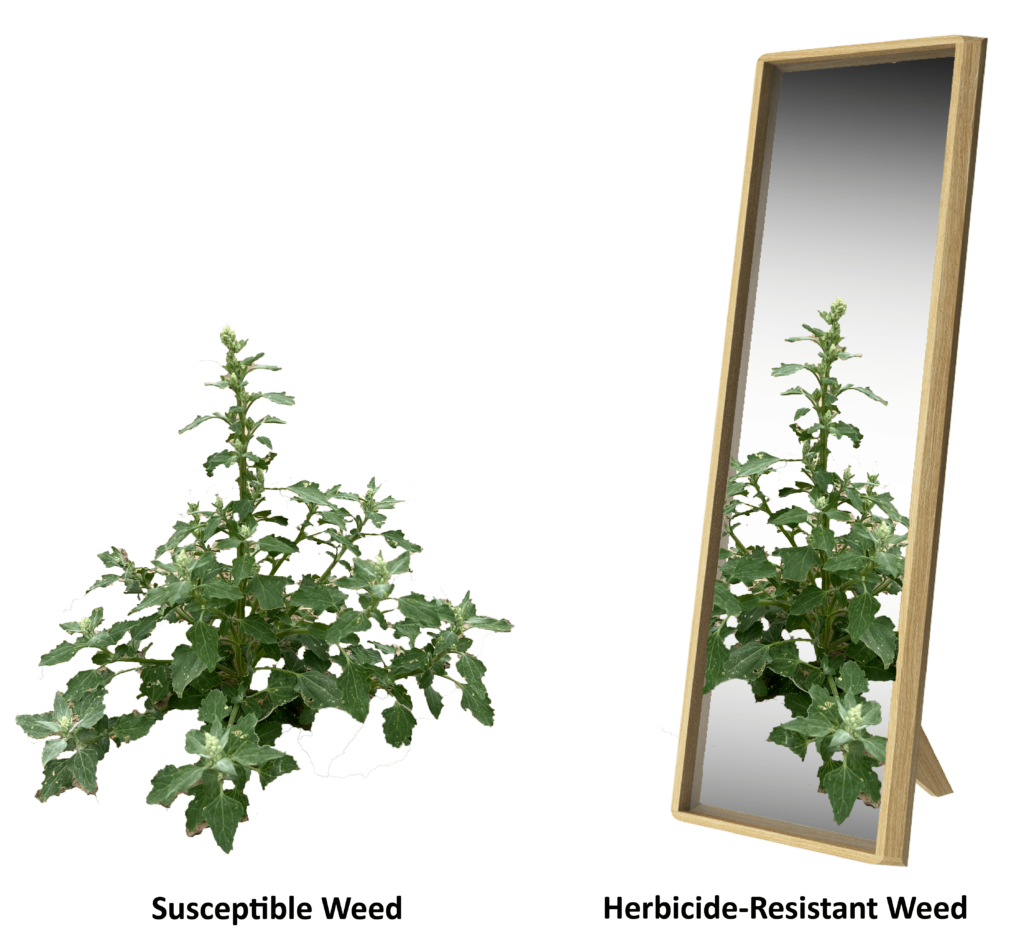
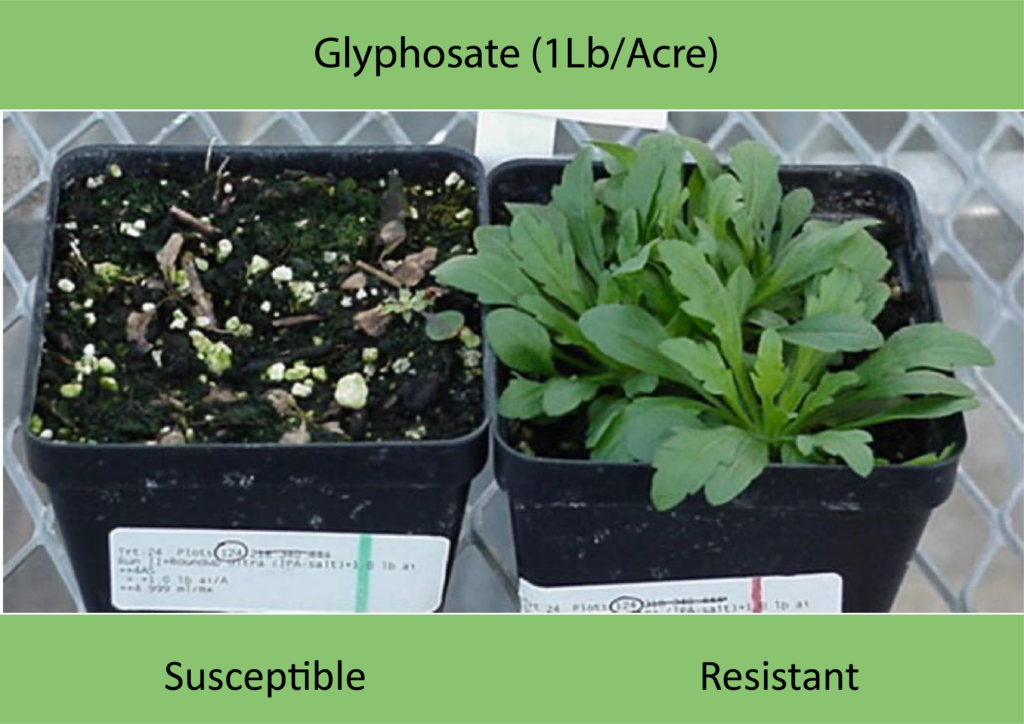
тАЬTriazine-resistant lambsquarters was identified in the mid- to late-seventies, and the fact that it is still showing up regularly on our Worst Weed Map and Troublesome Weed Survey indicates herbicide-resistance is not an issue that is going to away, nor is there an easy fix to this problemтАЭ says VanGessel.
Fortunately for the Commodity Classic attendees тАУ and all farmers! тАУ GROW and Take Action have numerous resources on managing this long list of troublesome weeds.
For help with individual weed ID and management recommendations, check out the GROW Weed ID library, as well as Take ActionтАЩs weed management factsheets.┬а
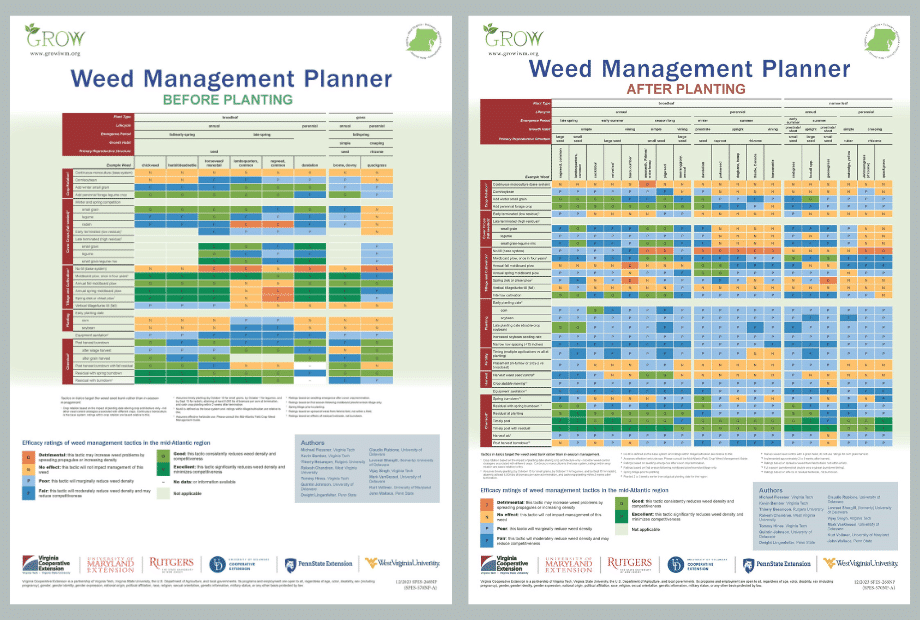
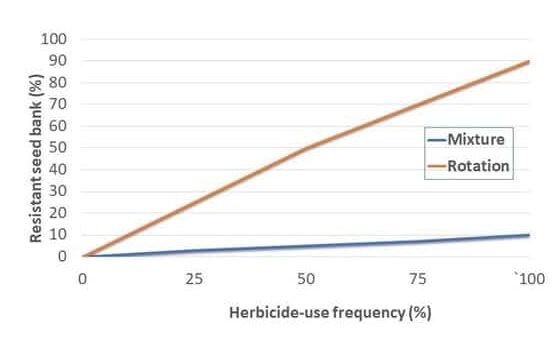
Get up to speed on how to manage herbicide resistance with integrated weed management on this GROW webpage, and review GROWтАЩs Weed Management Planner to see how common crop management practices might be impacting your weed species.┬а
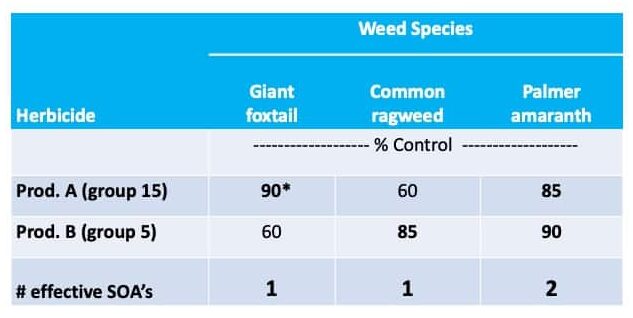
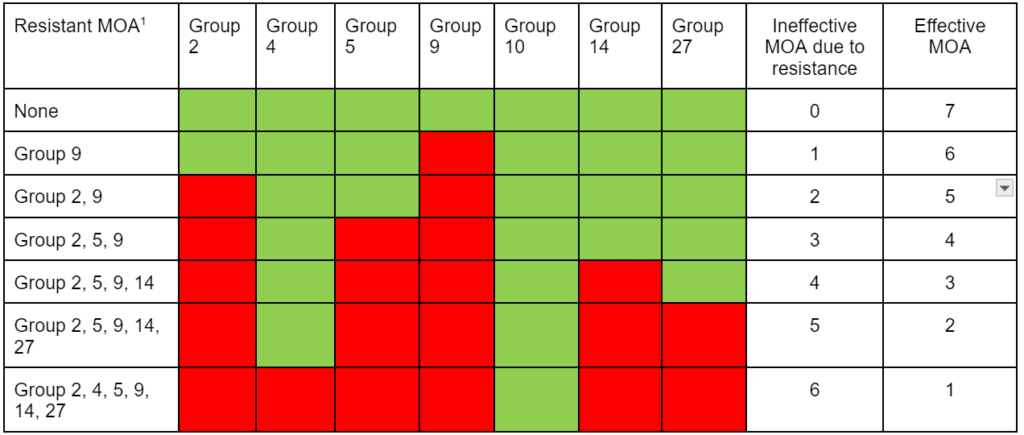
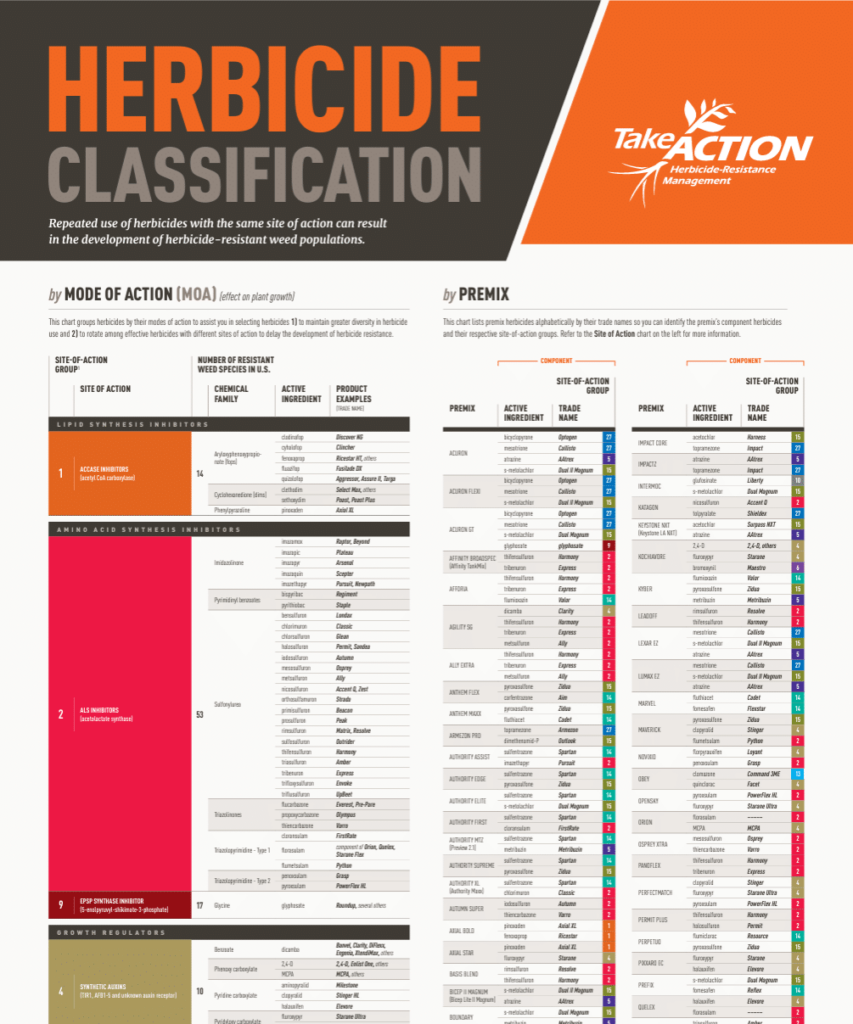
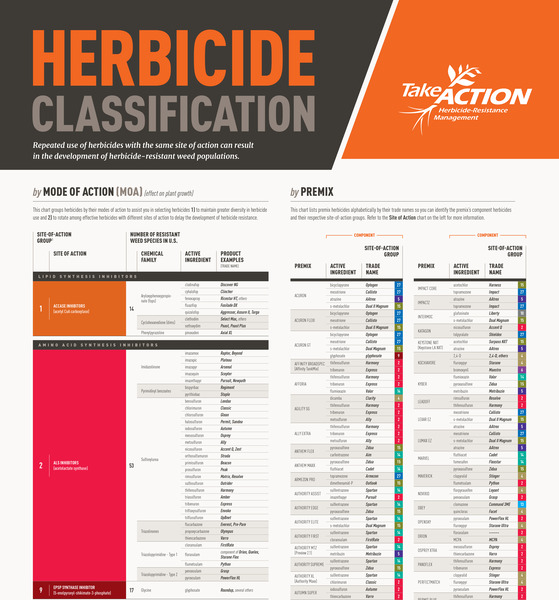
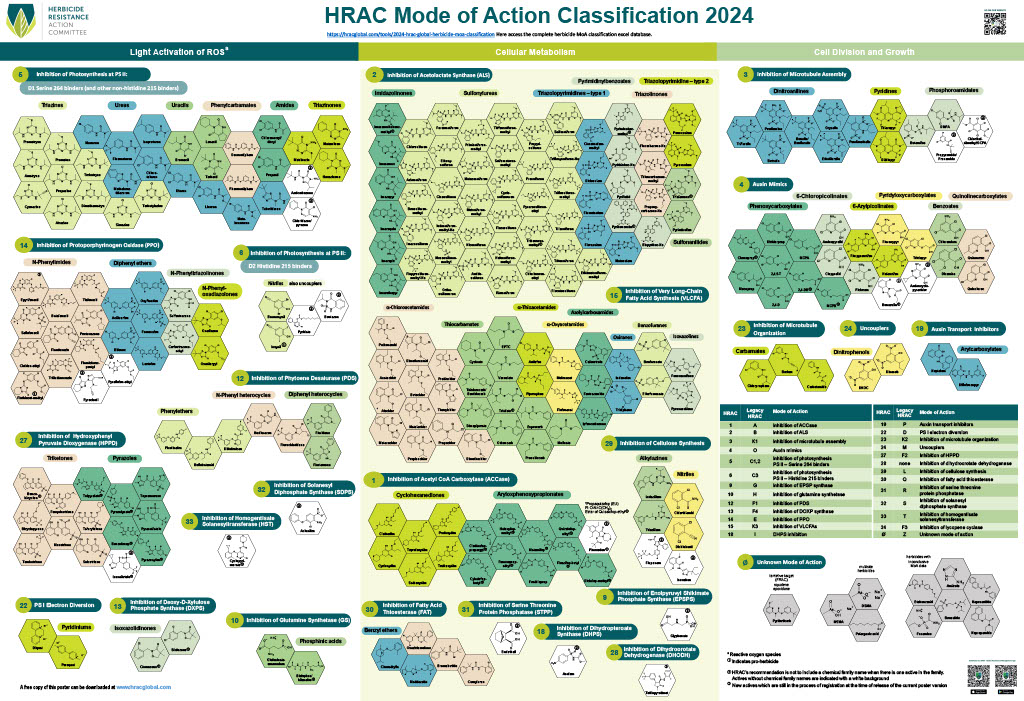
Finally before you spray this year, use the Take Action Herbicide Classification Chart to help you untangle the many herbicide products available to you by mode of action, and then use GROWтАЩs new digital tool, Check My Herbicide Plan, to see how many effective modes of action you are actually using in your spray program.┬а
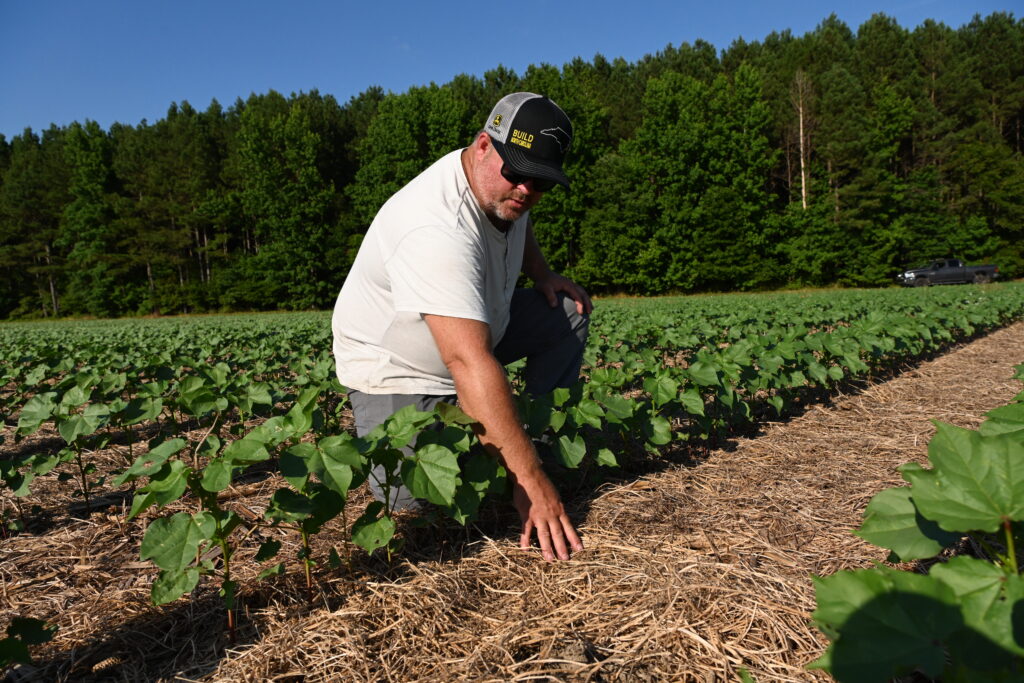
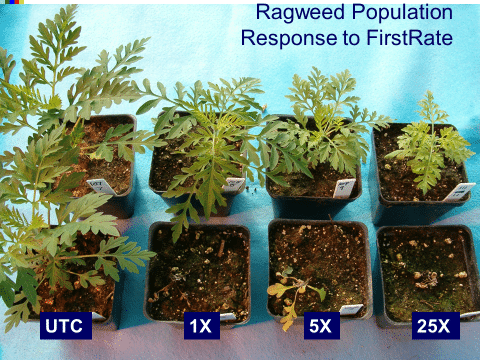
Article and feature photo by Emily Unglesbee, GROW; header image by Aaron Hager, University of Illinois; original feature photo by Rodrigo Werle, University of Wisconsin