After nearly three decades of cover cropping on the Eastern Shore of Maryland, Trey Hill was certain he was getting extra nitrogen from the legume species growing within his diverse, multi-species mixes.
But how much nitrogen he got – and how much he could cut back from his usual corn fertilizer program – was always a black box.
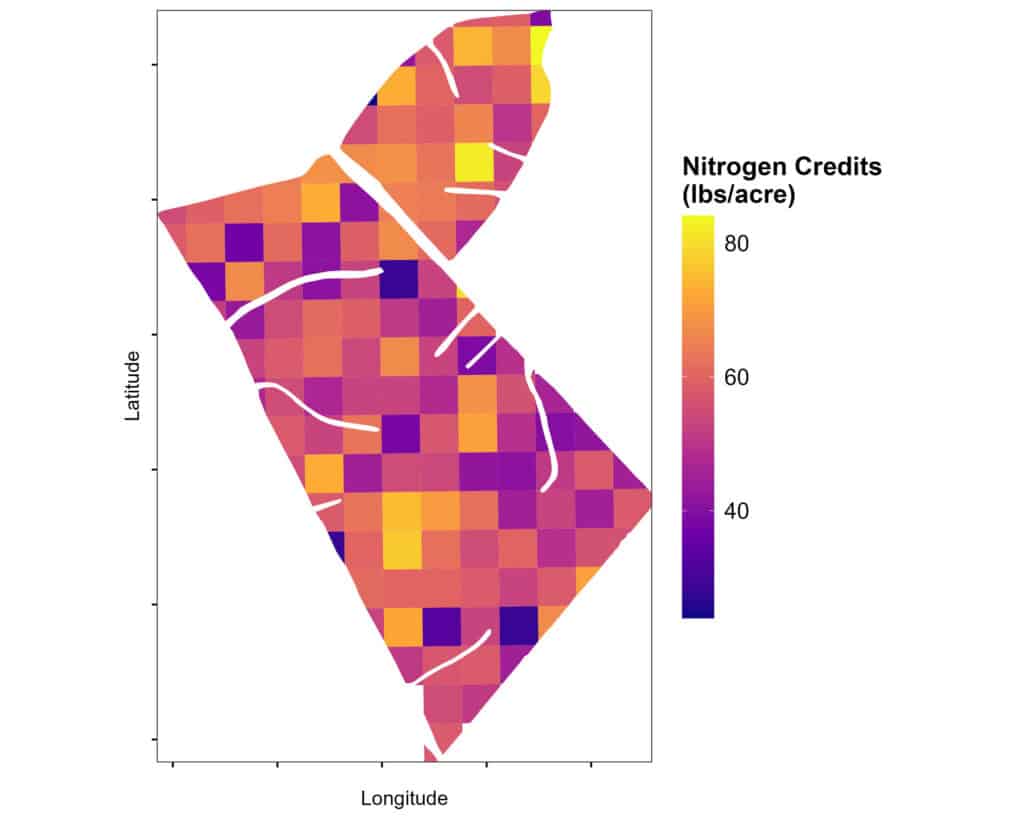
are revealing the wide variability present in many cover crop stands. (Chart credit: DASH)
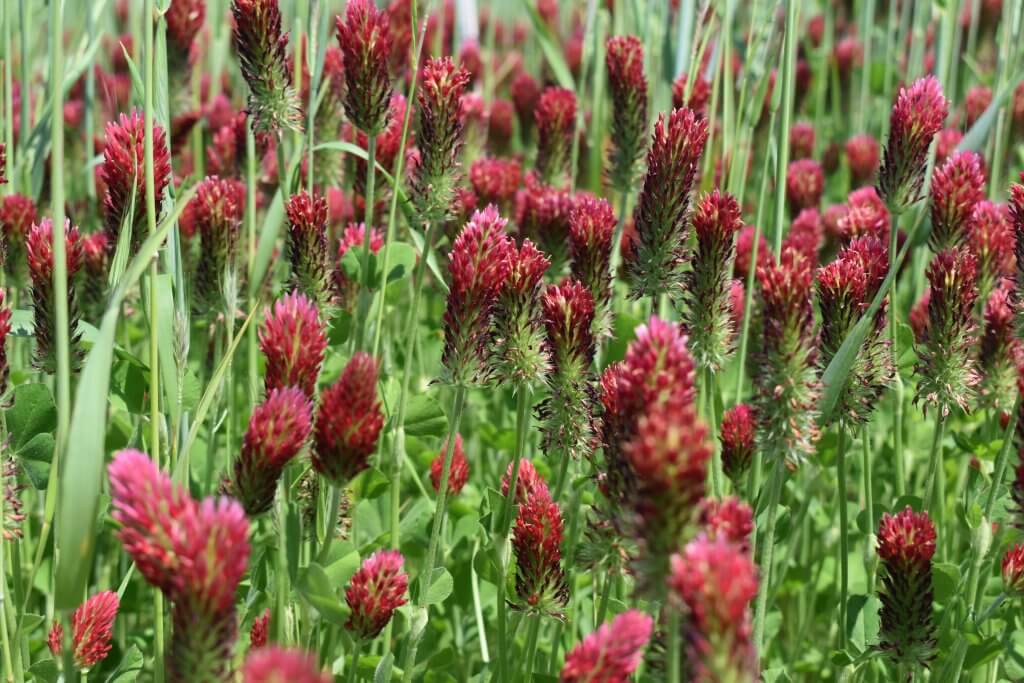
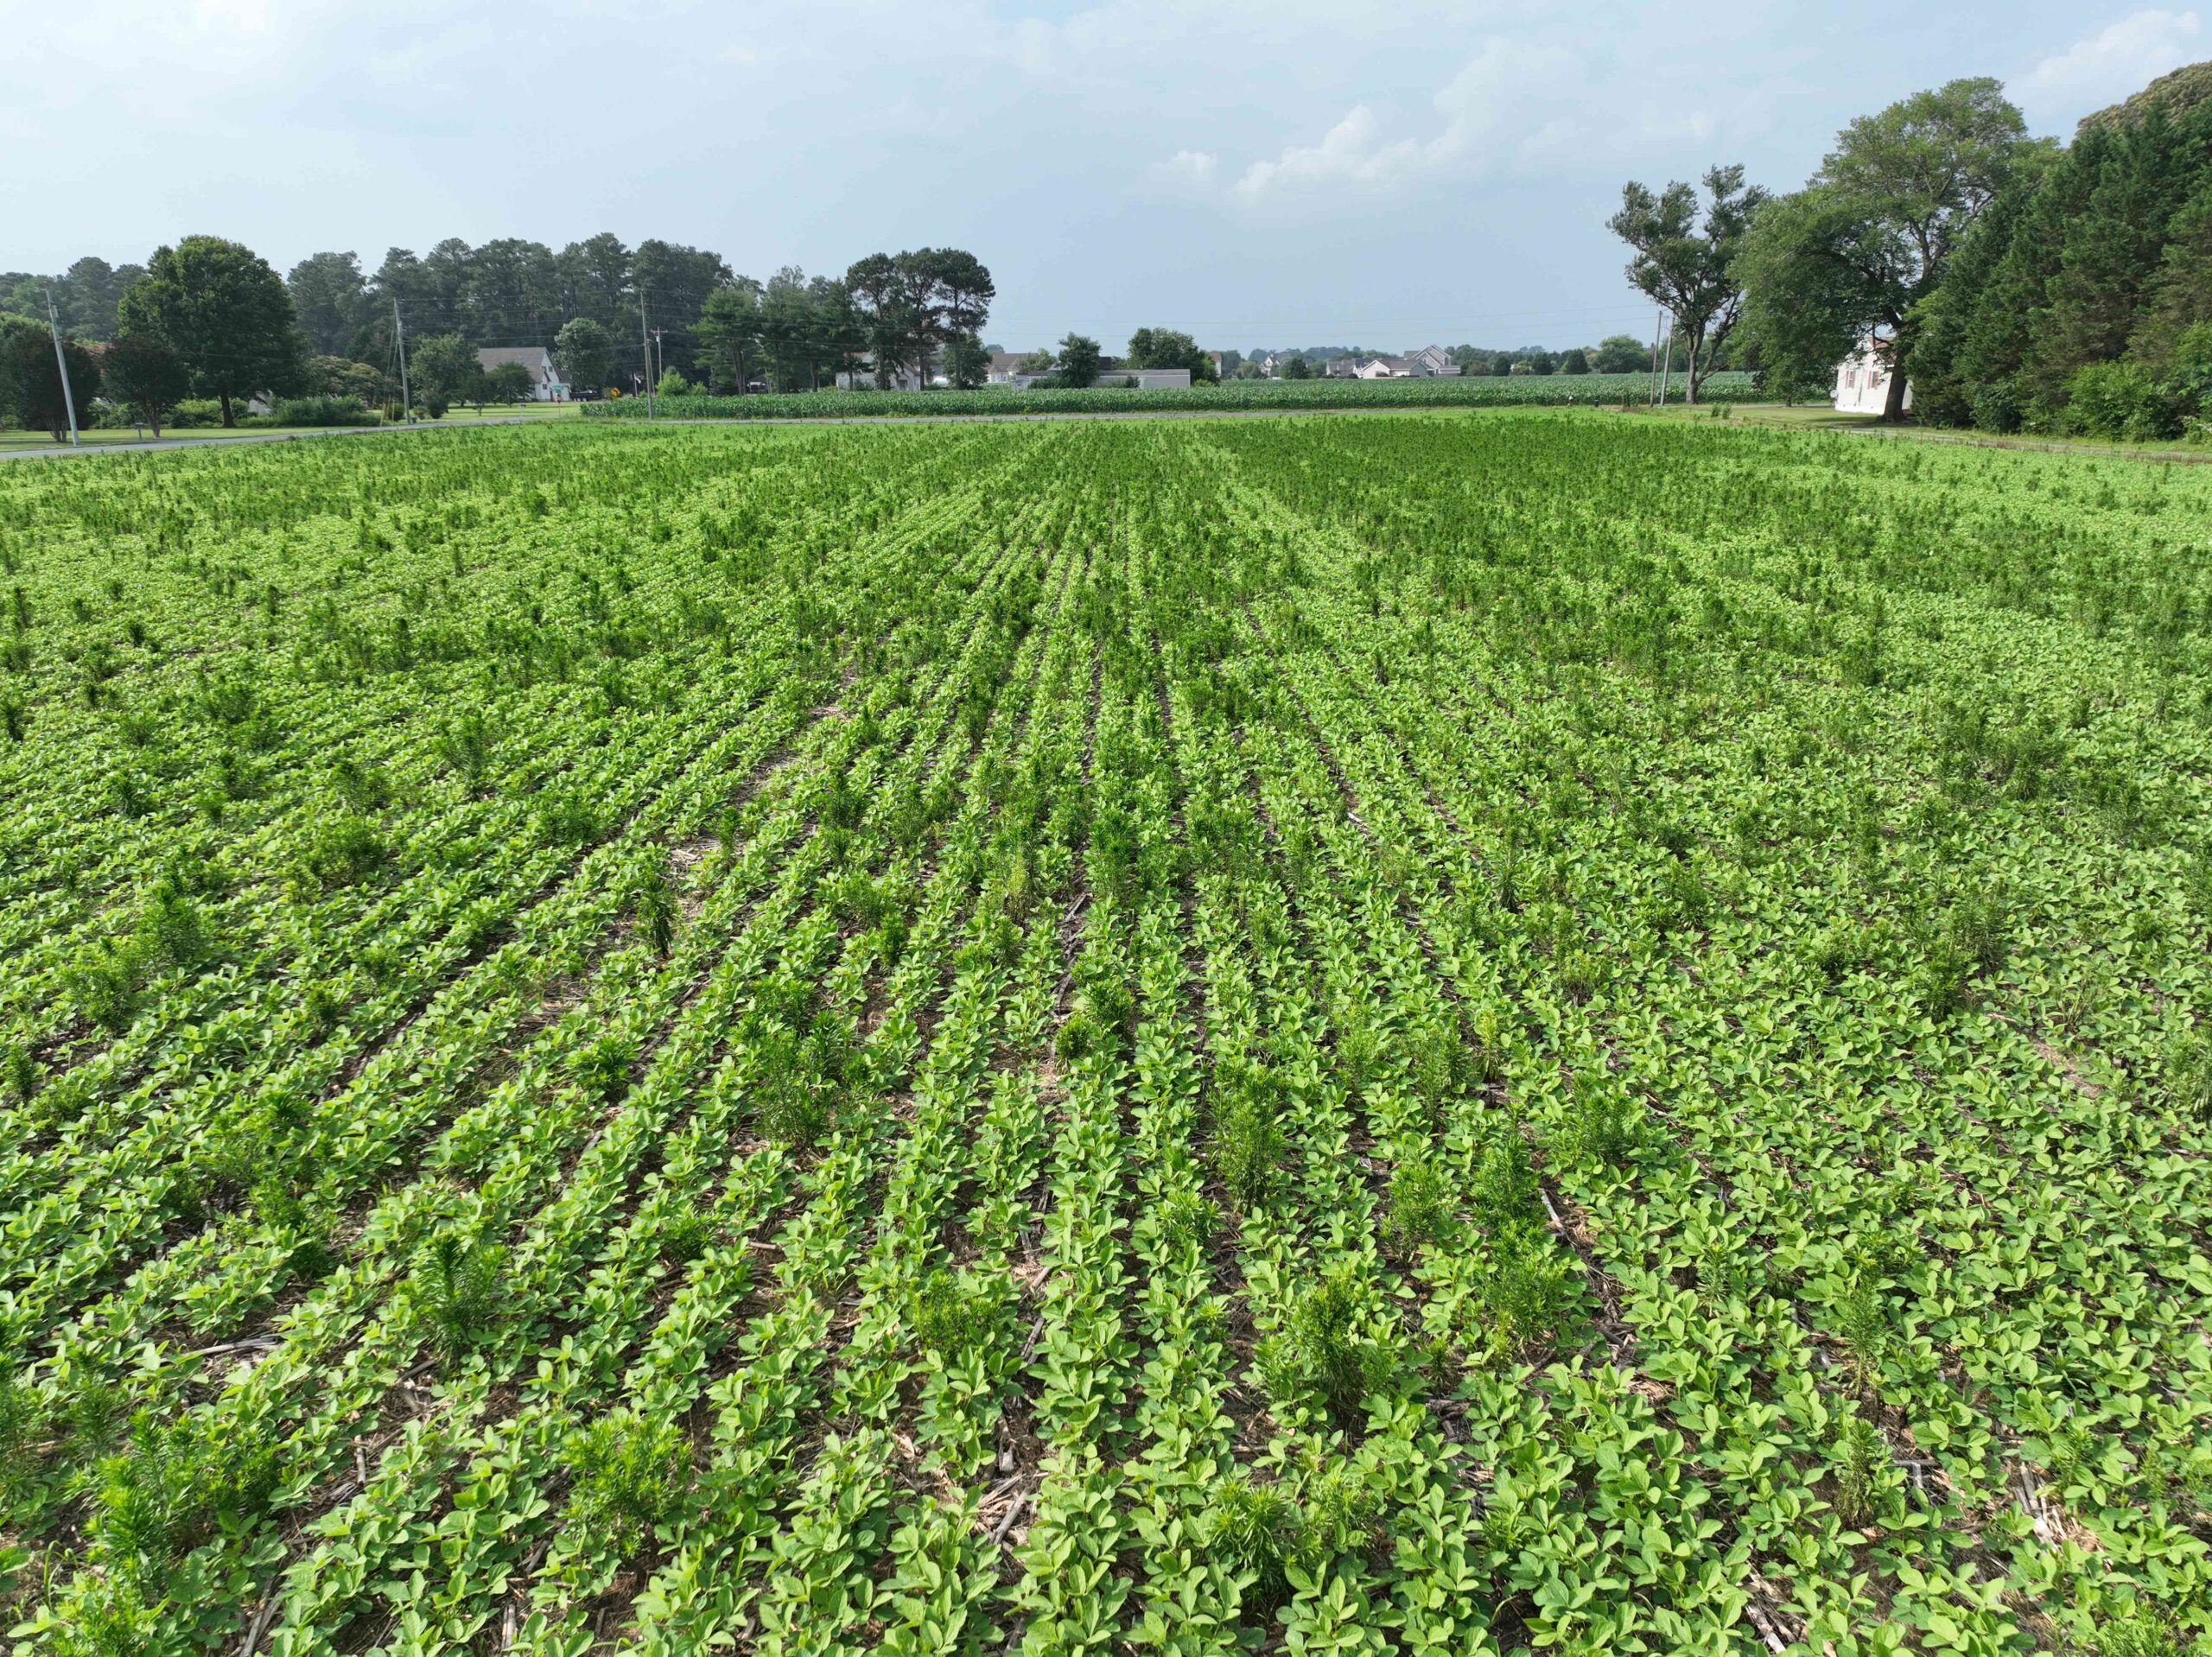
This spring, Hill has an answer. It comes via a brightly colored map of his fields, with each acre ranging from deep blue to bright yellow. The colors spell out what he long suspected – some acres are bursting with over 80 lbs of added nitrogen from a healthy stand of vetch, clovers and winterpeas. But where the cover crop stand was thin or spotty, some acres will receive fewer than 10 lbs of added nitrogen.
Better yet, Hill can now hand off this map to a cooperating retailer, Willard Agri-Service, and they will feed it into a variable rate application that takes into account his existing nitrogen credits and cuts back on those areas accordingly.
“We could never account for that in the past, because it’s so variable across the field,” Hill says of his Harborview Farms operation. “If you look at these maps, they go from almost 0 to 100 lbs credits. And you can’t just pick 50 lbs as an average and apply it across the field, because the sections that had zero added nitrogen credits would be terrible.”
This long-awaited solution for cover croppers is thanks to a bold new public-private partnership that aims to put conservation tools like these into farmers’ hands for little to no cost.
The program is twofold: first there is a USDA-backed tool called the Cover Crop Nitrogen Calculator, developed by a host of public organizations including the regional Cover Crop Councils, USDA’s new initiative, the Digital Ag Systems Hub (DASH), and the Precision Sustainable Agriculture group.
The calculator works hand in hand with a new USDA Regional Conservation Partnership Program (RCPP) grant program led by The Nature Conservancy. The grant aims to make PlantMap3D, DASH’s AI-powered plant mapping program (which can give the calculator the most accurate readings) available to hundreds of farmers across the mid-Atlantic, at no cost, through 2030.
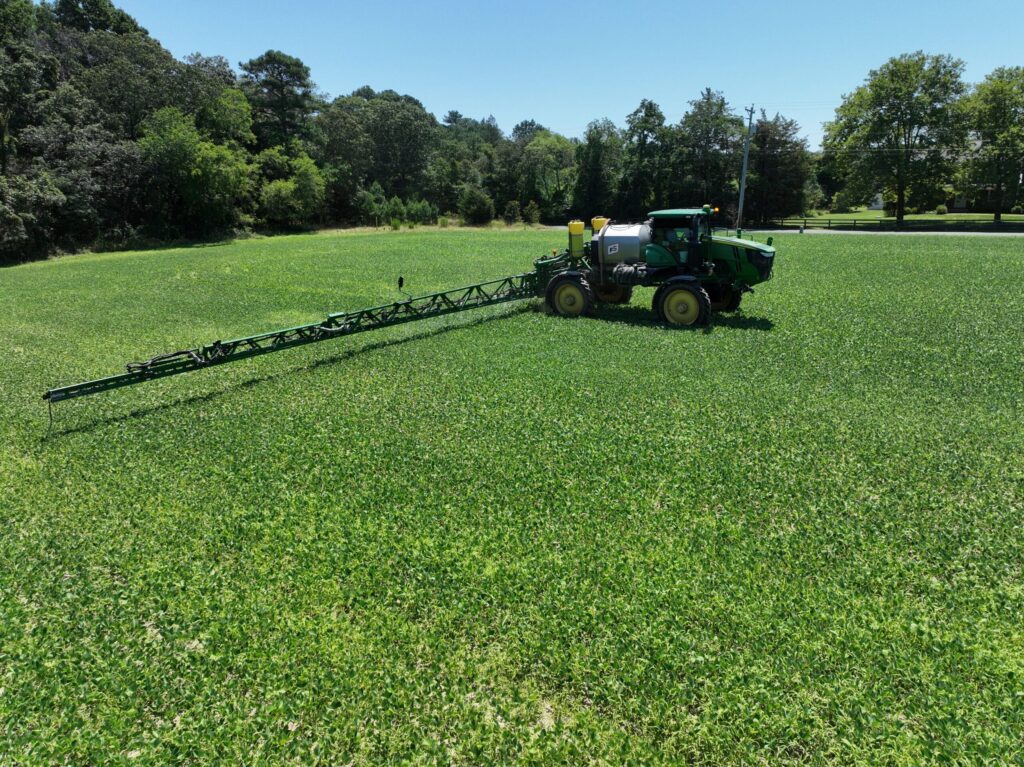
In the middle of this partnership are two ag retailers – Growmark FS and Willard Agri-Service, which are working with the Nature Conservancy and DASH to install camera sensors (called ModCams) on their sprayers. In turn, the retailers can offer the calculator’s resulting nitrogen credit maps and prescription application recommendations to farmers who use their services, explains Mike Twining, Chief Innovation Officer for Willard Agri-Service.
Twining, who helped initiate the project by introducing the DASH and PSA team and its technology to the Nature Conservancy, believes that agricultural service retailers can play a role in encouraging conservation practices at a larger scale, due to their large farmer networks. “Historically most grants and cost-share opportunities target non-profits or growers directly and individually,” he explained. “But I’ve long advocated to put more resources into advancing some of these programs at the retailer level.”
The goal is to make cover crops – and all their environmental benefits – as financially feasible for farmers as possible, explains Dr. Kristin Fisher, Science and Strategy Manager for the Nature Conservancy’s Chesapeake Bay Agriculture program.
“We want this to benefit farmers,” she said. “Farmers are already doing a lot to try to balance conservation and business management, and we want this technology and program to help them get more precise information on the fertilizer value of the cover crop they are already planting, or are interested in planting.”
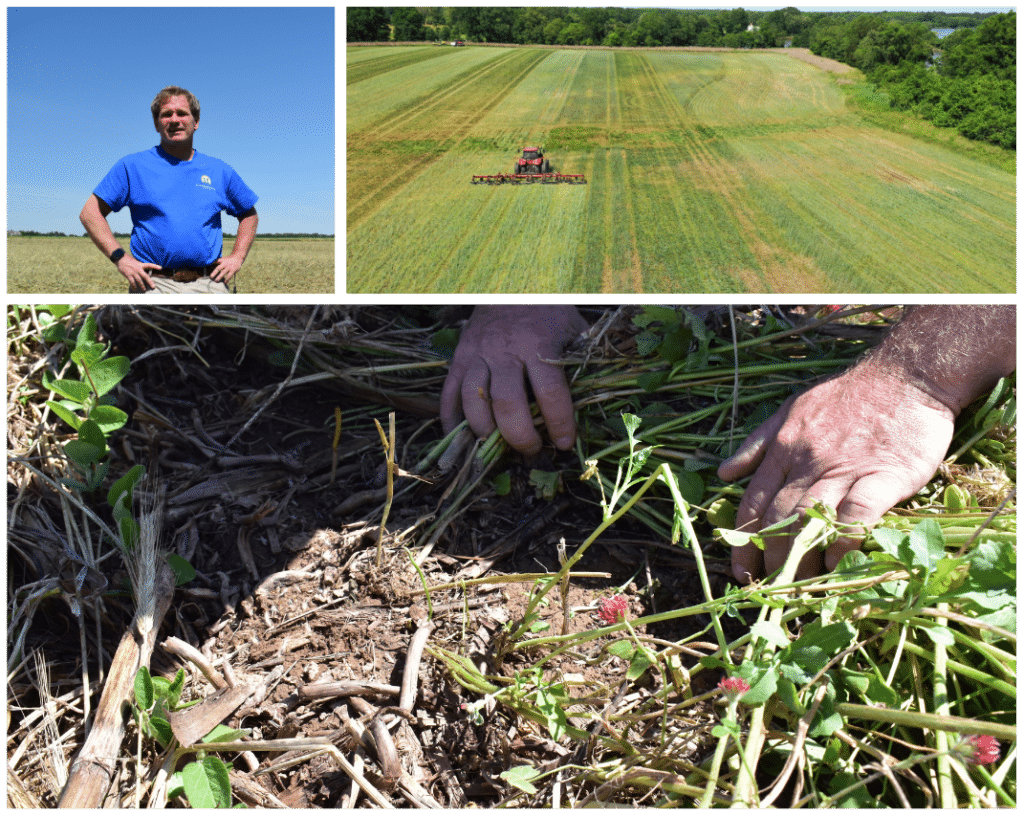
Trey Hill and his Maryland fields are some of the first to enter the new program, but the Nature Conservancy is aiming to reach 150,000 acres in Delaware, Maryland and Pennsylvania over the next four seasons, Fisher says. With a conservative estimate of 20 lbs per acre of nitrogen savings across those targeted fields, they hope to save farmers up to three million pounds of nitrogen – without sacrificing any yield.
“It’s thrilling to see this program roll out at scale with this partnership,” says Dr. Steven Mirsky, Director of Digital Agriculture for USDA-ARS and a co-developer of the PlantMap3D system with Dr. Chris Reberg-Horton of North Carolina State University. “We know cover crops can be an important source of new nitrogen for farmers, but their highly variable performance makes it so difficult to help growers make the best decisions for nitrogen management with cover crops. Merging the CC-NCALC with the PlantMap3D technology could be a truly transformative way to merge precision and sustainable agriculture.”
How It Works
The Cover Crop Nitrogen Calculator needs detailed estimates of how much cover crop biomass from which species are in a farmer’s field at the time of termination. There are three ways farmers can retrieve and feed that information into the calculator.
Eyes in the Field: User Samples. The first is a manual process of sampling, drying and sending cover crop biomass samples off to a lab to get a single fieldwide estimate on how much nitrogen is held in the plant and at what rate it will become available as it decomposes.
That’s a tough sell to farmers facing busy spring seasons, so the other two pathways aim to remove this obstacle, by using PlantMap3D or satellite imagery.
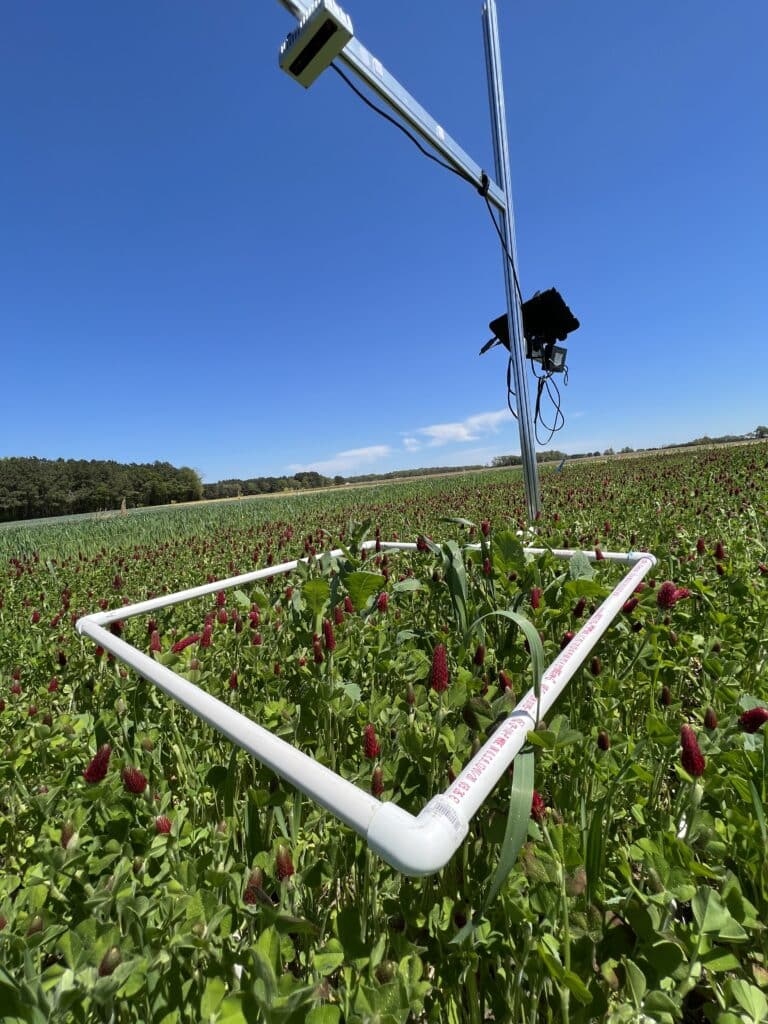
Eyes on The Tractor: PlantMap3D. PlantMap3D is a hardware and software system run by the DASH initiative. The system is powered by ModCam camera sensors mounted on tractors that can rapidly map, identify and measure the biomass of crops, cover crops and weeds. Via the RCCP grant, it is now available to farmers via Willard Agri-Service and Growmark FS retailers in the mid-Atlantic for cover crop mapping.
Farmers can sign up and let the retailers map their field in a single field pass as they terminate the cover crop with herbicides, explains Twining. The data is then fed into the calculator, which takes into account soil properties and weather data, to generate a chart showing the expected nitrogen availability in the field as it rises and then falls across the season. This information is then channeled into nitrogen credit maps that the retailers can use to create and execute a matching variable rate application map for farmers.
Because DASH is still fine-tuning and validating its mapping software and calculator, the grant offers farmers an insurance incentive, Fisher notes. The application map contains some areas that default to a farmer’s typical nitrogen application, as a check. If yield maps show that the farmer lost yield on the areas where the retailer applies less to account for a cover crop nitrogen credit, the program makes up the difference, up to $50/acre.
“It’s functioning as a safety net, so hopefully we can give them some confidence that they can take the risk, follow the nitrogen recommendations and if it doesn’t work out, we offset any reduction in income,” Fisher explains.
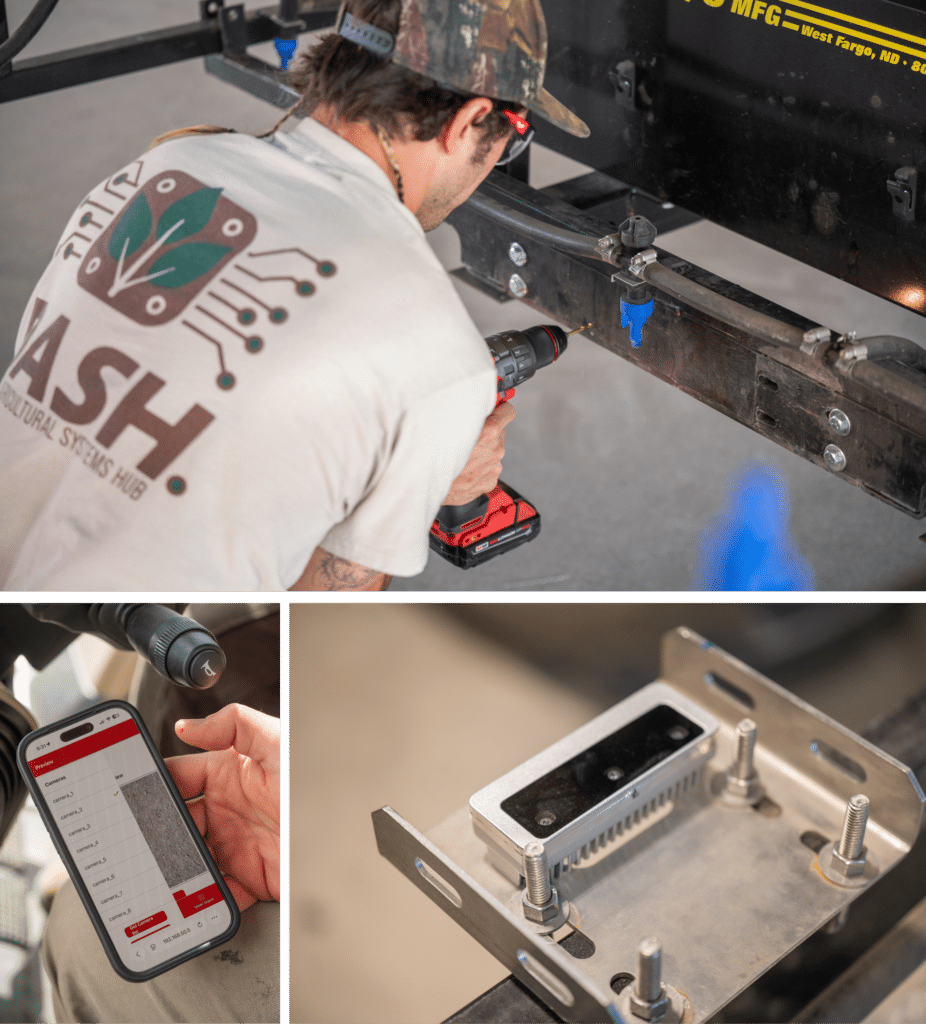
onto a sprayer boom. (Photo credits: Grand Farm)
Twining says the team at Willard is busy becoming proficient at using the camera sensors this year and is optimistic about its future use among mid-Atlantic farmers.
“It’s an opportunity to reduce the volatility of nitrogen fertilizer costs in your operation, while gaining some of the traditional benefits of cover crops from a soil health and weed management and biological perspective,” he explains.
The retailers, Nature Conservancy, and DASH are all learning and adjusting to the realities of ongoing cover crop experimentation amid mid-Atlantic farmers, Fisher and Twining both noted. While they hope to accommodate all practices in the future (such as planting green), right now the PlantMap3D system works best for growers who are planting single or multi-species mixes with legumes and terminating them at the same time before planting.
“If you’ve been growing a single cover crop like rye, see if there is a multi-species mix with legumes that could work for you,” Twining urges. “And if you’re already planting multi-species mixes, we can talk about how you’re managing them so we can use this technology to get you this benefit on the nitrogen side.”
Eyes in the Sky: Satellites. The third option for getting your cover crop biomass into the nitrogen calculator is a satellite-based detection system that is under active development, says Dr. Jyoti Jennewein, a research physical scientist with USDA ARS. For this pathway, farmers can enter their field information into the calculator just before their typical nitrogen sidedressing date.
Using multispectral readings from NASA’s Harmonized Landsat-Sentinel satellite imagery, researchers from the University of Maryland, USDA-ARS, and Tennessee State University created models that can estimate cover crop biomass for monoculture cover crop fields containing cereal rye, barley, wheat or triticale. The calculator then pulls weather data and soil properties in, and generates the same nitrogen availability charts and credit maps.
While this pathway is only available for cereal cover crops at the moment, researchers are hard at work building satellite-imagery models for multi-species mixes that include legumes, which should be available in the coming year, Jennewein says.
Moreover, the satellite pathway’s estimates are likely to get sharper and even more accurate as NASA launches new, cutting-edge hyperspectral sensors such as EAGLE-VSWIR in the next 36 months, she adds. Current work using the NASA EMIT sensor demonstrates that these specialized sensors can better estimate the biological characteristics of cover crop biomass, which will fine-tune the resulting nitrogen credit estimates.
What’s At Stake
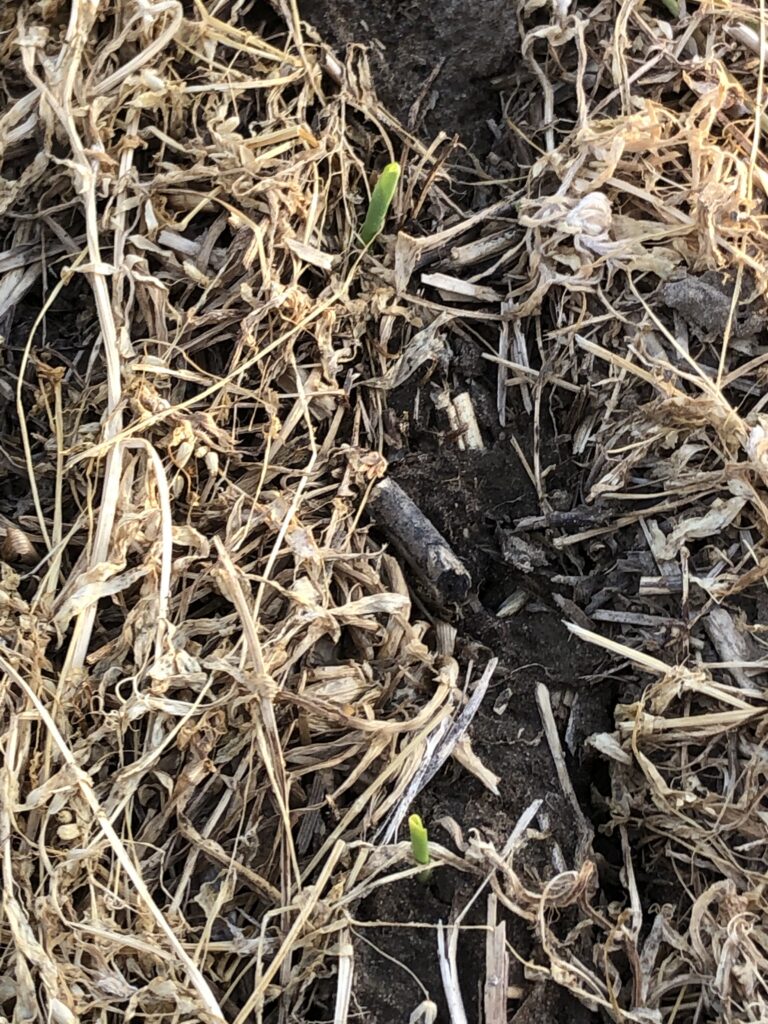
The program couldn’t come at a better time for farmers, says Austin Menker, an Extension conservation agronomist at NC State. “I get so many calls asking how much nitrogen can I take away from my program this year, following a legume cover crop,” he says. “It’s almost impossible to answer. Even if I visit their exact field, I can only give educated guesses.”
There’s a flipside, too. Cover crops don’t always offer nitrogen to the following crop. Some species, such as small grain cereals, actually use nitrogen as they decompose, and can hurt nitrogen-hungry crops like corn trying to grow in the same field. The phenomenon, called “nitrogen immobilization” can be a real deterrent to cover crop use, Menker notes. Farmers try to guess how much extra nitrogen they need and – with the threat of lost yields hanging over their head – may overcompensate.
Because nitrogen is water soluble, it’s easily lost via runoff and rain events, especially when farmers apply more than their crop can uptake at application time. The leached nutrient not only harms nearby ecosystems – like the Chesapeake Bay, where the new RCPP program is targeted – but it costs farmers in wasted inputs and lost yield potential, at a time when farms are operating on dangerously thin economic margins, Menker notes.
“If we’re more accurately adjusting our nitrogen based on credits from cover crops, we can really limit leaching,” Menker says. “And since the tool can also map out when the nitrogen is available, we can adjust the timing of application. It’s basically allowing for extremely farm- and field-specific management that is going to be crucial to the future use of cover crops.”
Fisher hopes the project’s attentiveness to the financial realities and risks of farming will help it succeed, as will its social science component. The Nature Conservancy team is using the results to understand how farmers approach new technology and conservation practices, and what incentives and support systems can help them adopt them more rapidly and successfully.
This farmer-focused approach was a key part of what led Willard Agri-Services to champion and then cooperate with the project, says Twining. “Farmers are running a low-margin, high-capital business,” he explains. “It’s not a business platform that always has a lot of discretionary capital sitting around to innovate with unproven technologies. There’s a low tolerance for risk because you can’t afford it.”
How To Participate
The Cover Crop Nitrogen Calculator is currently live, and farmers are invited to explore the different pathways to use it.
Mid-Atlantic farmers who are interested in participating in the RCCP grant program that uses the PlantMap3D pathway for the 2027 season can reach out to the Nature Conservancy or either cooperating retailer, Fisher says. Visit this website and factsheet for more details on who qualifies and how to connect.
For farmers elsewhere, consider the satellite option and stay tuned, Fisher and Mirsky say. The goal is for programs like this to be available more broadly, as the DASH team expands and validates its mapping technology, and fine-tunes the satellite readings in the calculator.
Article and header photo by Emily Unglesbee, GROW; feature photo graphic by Emily Unglesbee and Claudio Rubione, GROW